According to the annual ranking of Forbes Global 2000 which measures the world's largest public companies, Shanghai Pharmaceuticals ranked first among the top Chinese pharmaceutical companies in terms of sales value in 2025, amounting to approximately 38 billion U.S.
www.statista.com
Compared to that, the total value of the Pharma sector in India is poor by comparison,
When you try to be more Chinese than @Jiangnan, and more American than original American, you should know that medical sector in India is never consider a pure business. Tata Institute of fundamental research has developed a medicine for prevention of cancer. Do you know that what price have they kept for that medicine? 1 USD.
Those who believe in pure materialism cannot understand this spirit of service to mankind. In case you have to perform any eye surgery or dental surgery, contact me and come to India. I will get it done at free of cost. You guys too have benefited from Cost effective and high potency from India. You are unwilling to accept it. When you guys are in trouble, you remember us. In good time, you make others your fathers and grandfathers.
India's life expectancy is over 70 years. Here is the table. By the way what is the life expectancy in BD in current situation. We have doubled that in 75 years from 35 years to 70+ year.
Life expectancy at birth indicates the number of years a newborn infant would live if prevailing patterns of mortality at the time of its birth were to stay the same throughout its life.
Life expectancy at birth indicates the number of years a newborn infant would live if prevailing patterns of mortality at the time of its birth were to stay the same throughout its life.
Life expectancy at birth indicates the number of years a newborn infant would live if prevailing patterns of mortality at the time of its birth were to stay the same throughout its life.
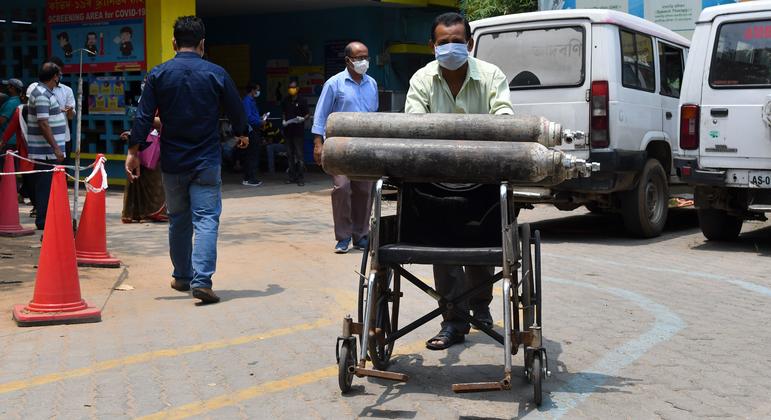
Scenes of relatives desperately trying to find oxygen supplies for hospitalized COVID-19 patients in India last year, alerted the world to an acute, deadly problem. Yet that was not this first time the country’s hospitals have been hit by a shortage of the life-saving gas, prompting the question...
Usually is dont respond to like's of you , but for the record we are not here becaue of you nor we care what you want from us or percive or want us to think and do ... we are not ruled by either any china proxy communist goverment nor China so we dont care about you
sure China is biggest trading Partner with trade imbalence in favour of China since China is manufacturing workshop of almost every Japnese , S Korean and European and American corporation since last three decades ...
sure we are late but we are getting to owr Goal , sure there are massive problem's in the way like Incompetnce & corruption or beurocrats & politicians & internal & external pressure's deu to crime or war's and there aftermath's and many level's of sectarian divission's but that dose not mean's we stopped in owr work and started blaming others for owr setback's and thats why even after so many problem's deu to democracy and related problem's we still manged to reach here and pretty sure we are on the right path to progress dont worry about us

 South Asia